Vehicle-mounted air compressor manufacturer, VMAC, is back once again with its fourth State of the Mobile Compressed Air Industry survey. For the 2023 report, VMAC surveyed 331 individuals between December 2022 and April 2023. These individuals came from a variety of industries such as construction, oil and gas, forestry, municipal, mining, transportation, agriculture, and utilities infrastructure. One thing each participant had in common—although each represented various industries and held different job titles—is that they use mobile air compressors.
Much like last year’s survey, VMAC included questions about the supply chain and effects of COVID-19 in this year’s report. The company also covers questions about the truck chassis shortage, electric vehicles, and additional questions about the supply chain that has continued to affect the industry over the last year. Read on to find out how the industry outlook has changed for key topics from 2022 to this year.
job title
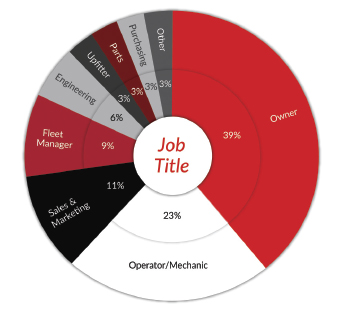
SELECT THE JOB TITLE/FUNCTION THAT BEST DESCRIBES YOU
The largest group of respondents consisted of owners (39%), which decreased by 3% from 2022. Operator/mechanics consisted of 23%, up 3% from last year. Other respondents included sales and marketing (11%), fleet managers (9%), and people in engineering (6%). Upfitters, those in parts and purchasing departments, and other each represented 3%.
industries represented
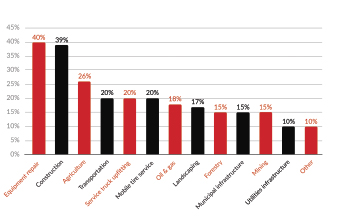
WHAT INDUSTRY DO YOU SERVE? CHECK ALL THAT APPLY
Instead of segmenting industries and applications into two different questions, VMAC combined them into one. While an exact comparison from the previous reports can’t be made, there is still a consistent trend. Two categories that take the top spot are equipment repair (40%) and construction (39%).
fleet size
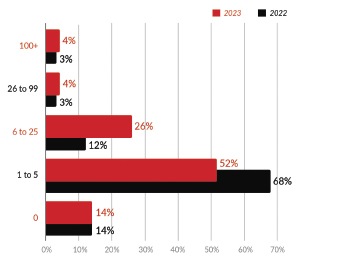
HOW MANY SERVICE TRUCKS ARE IN YOUR COMPANY’S FLEET?
In previous surveys, respondents had small fleets of 1 to 5 service trucks, but this segment has declined over the years. In 2021 it was 75% and in 2022 it was 68%. Now, in 2023, it’s 52%. The 6 to 25 service truck category is growing with over 26% of respondents falling into this category, significantly higher than the 12% in 2022 and 9% in 2021.
vehicle class
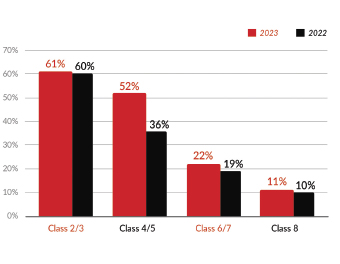
WHICH CLASSES OF SERVICE TRUCKS DO YOU HAVE IN YOUR FLEET? CHECK ALL THAT APPLY
Like last year, Class 2 and 3 fleets make up the majority of fleets with 61% while Class 4 and 5 consisted of 52%, Class 6 and 7 of 22%, and Class 8 of 11%. VMAC reports that a high number of respondents in the agriculture, mobile tire service, upfitting, and transportation industries skewed the overall data in favor of Class 2 and 3 vehicles. All other industries are more likely to have Class 4 and 5 service trucks in their fleets.
vehicle class
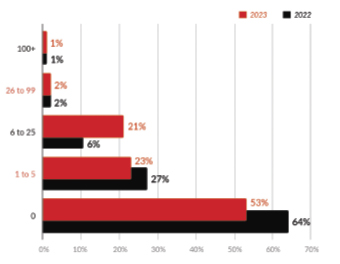
HOW MANY SERVICE VANS ARE IN YOUR FLEET?
The number of fleets with service vans has significantly increased from 36% in 2022 to 47% in 2023. Additionally, fleets with 6 to 25 vans rose from 6% to 21%. As VMAC has predicted for years, vans are growing popular in fleets, but it’s unclear whether this increased adoption is due to limited truck chassis availability, a growing respect for work vans, or both.
age of fleet
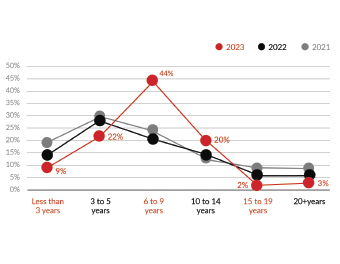
WHAT IS THE AVERAGE AGE OF SERVICE VEHICLES IN YOUR FLEET?
The average age of service vehicles is notably higher than last year. In 2022 vehicles ages 0 to 9 made up 62% of fleets. Most of this year’s respondents fall into the 6 to 9 years bracket at 44%. VMAC suggests the chassis availability and an increase in used vehicle purchases may be the cause of this shift.
future service vehicles
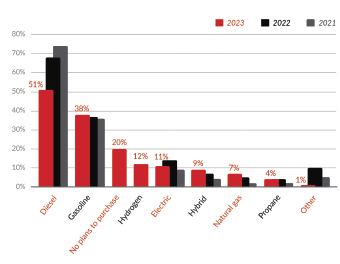
WHAT KIND OF SERVICE VEHICLES ARE YOU INTERESTED IN PURCHASING? CHECK ALL THAT APPLY
Diesel vehicles remain the most popular kind of service truck, but interest has significantly dropped. Only 51% of 2023 respondents are interested in purchasing a diesel vehicle in the future, compared to 68% in 2022. Gasoline was the second most common choice (38%), followed by hydrogen fuel (12%), electric (11%), hybrid (9%), and natural gas (7%).
ev concerns
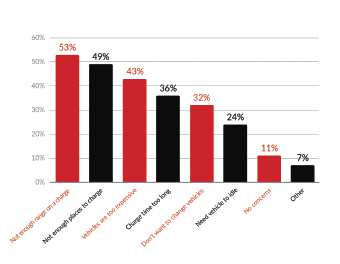
DO YOU HAVE ANY CONCERNS ABOUT SWITCHING TO AN EV SERVICE VEHICLE? CHECK ALL THAT APPLY
Respondents indicated range (53%), charging availability (49%), vehicle price (43%), and charge time (36%) as their primary concerns regarding EVs. These concerns have increased compared to last year. The need to idle, a new survey option, was selected by 24% of respondents and was reflected across all industries, but most common in mining, forestry, and agriculture. Numerous respondents commented cold weather, battery longevity, and inability to purchase EVs under the “other” option.
air compressors in the fleet
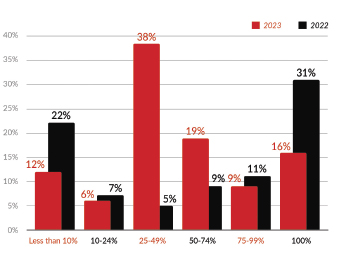
APPROXIMATELY WHAT PERCENT OF YOUR SERVICE VEHICLES ARE EQUIPPED WITH AIR COMPRESSORS?
In previous years, there was a notable divide on whether service vehicles still have air compressors. Respondents seemed to take an “all or nothing” approach to adding air compressors on their trucks. This trend drastically changed in the 2023 survey—57% indicated they have air compressors on 25-74% of their vehicles. VMAC considers that it’s possible that the work truck industry has adapted to supply chain challenges and replaced some vehicles and equipment, which would explain this shift.
cfm requirements
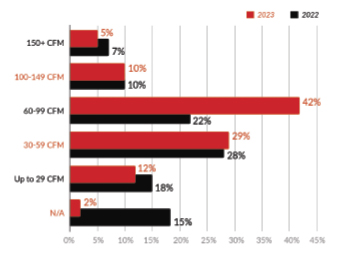
WHAT CFM RANGE BEST FITS YOUR REQUIREMENTS FOR YOUR SERVICE VEHICLES?
4 out of 5 people (83%) answered that under 100 cfm was the requirement for their service trucks, an increase from last year’s 68%. 41% of respondents stated they only require up to 59 cfm while 10% selected 100 to 149 cfm. VMAC notes the most considerable shift in results occurred in the 60 to 99 cfm range, which increased from 22% to 42%. This change could be explained by the increasing adoption of battery electric tools, which can replace small air tools but aren’t powerful enough to displace larger tools/equipment.
psi requirements
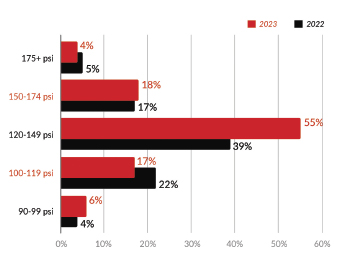
WHAT PSI RANGE BEST FITS YOUR REQUIREMENTS FOR YOUR SERVICE VEHICLES?
55% of respondents agree that 120 to 149 psi is required for their service vehicles, which is consistent with the psi requirements for most air tools today. 18% of respondents require 150 to 174 psi, while 17% require 100 to 119 psi. The remaining responses of 90 to 99 psi (6%) and 175-plus psi (4%) are outliers. As these trends are similar to last year’s report, this indicates that psi needs have remained stable.
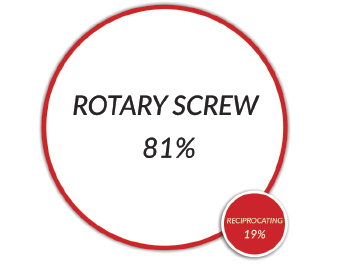
rotary screw vs reciprocating
DO YOU PREFER ROTARY SCREW OR RECIPROCATING AIR COMPRESSORS FOR SERVICE VEHICLES?
81% of respondents prefer rotary screw air compressors, an almost identical outcome to the 2022 and 2021 survey results.
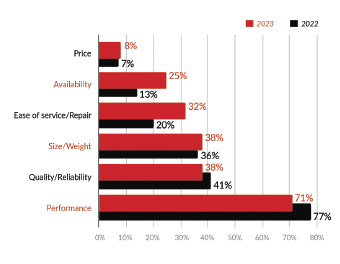
WHY DO YOU PREFER ROTARY SCREW AIR COMPRESSORS FOR SERVICE VEHICLES? CHECK ALL THAT APPLY
71% of respondents said they preferred rotary screw air compressors because of their performance. Other reasons included quality/reliability and size/weight, both at 38%.
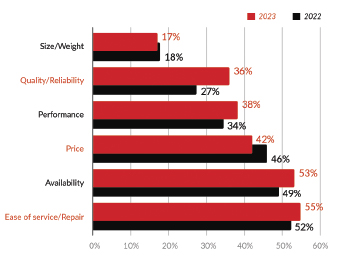
WHY DO YOU PREFER RECIPROCATING AIR COMPRESSORS FOR SERVICE VEHICLES? CHECK ALL THAT APPLY
When asked why 19% of respondents preferred reciprocating air compressors, the top answers were ease of service/repair (55%) and availability (53%).
air compressor systems
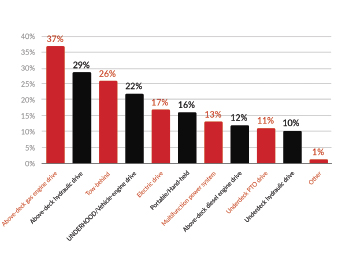
WHAT TYPE OF AIR COMPRESSOR SYSTEM DO YOU USE ON SERVICE VEHICLES?
CHECK ALL THAT APPLY
37% of respondents said they use abovedeck gas engine drive air compressors, similar to 2022. Abovedeck hydraulic drive (29%) was the next most popular air compressor system, followed by tow behind (26%) and UNDERHOOD/vehicle-engine drive (22%).
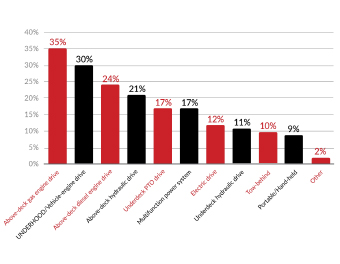
WHAT TYPE OF AIR COMPRESSOR SYSTEM DO YOU PREFER ON SERVICE VEHICLES?
CHECK ALL THAT APPLY
When asked about their preferred type of air compressor system, 35% of respondents said they prefer gas engine drive air compressors, an increase from 28% in 2022. UNDERHOOD/vehicle-engine drive fell from 34% to 30%. Rotary screw gas engine drive air compressors are a relatively new introduction to the market, according to VMAC. Gas engine drive air compressors have consistently grown in popularity, which could explain the shift in this year’s survey results.
covid’s impact
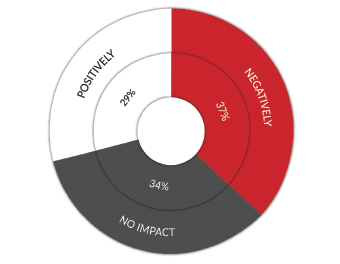
HOW HAS COVID-19 IMPACTED YOUR BUSINESS?
37% of respondents reported that COVD-19 negatively impacted their business, a 10% decrease from 2022. While fewer respondents stated their businesses were negatively affected, more respondents reported that COVID has positively impacted their businesses (29%). VMAC notes that this swing in results could mean that businesses feel relief and see their hard work and resilience paying off from the past three years.
chassis shortage impact
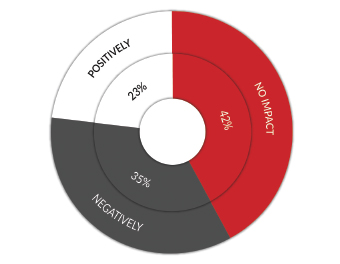
HOW HAS THE SHORTAGE OF TRUCK CHASSIS IMPACTED YOUR BUSINESS?
One in three respondents (35%) was negatively impacted by the truck chassis shortage, an improvement over the 46% in 2022. 42% reported no impacted. The largest shift occurred when 23% of respondents noted a positive impact, up from 6% from 2022. VMAC considers this change could be attributed to the increased representation of respondents with 6 to 25 vehicles in their fleet; however, large fleets bear the brunt of the chassis shortage, with 87% of fleets with 26 or more vehicles experiencing the negative impacts.
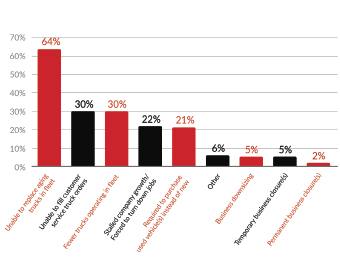
IN WHAT WAYS HAS THE SHORTAGE OF TRUCK CHASSIS IMPACTED YOUR BUSINESS? CHECK ALL THAT APPLY
Of those impacted by the chassis shortage, 64% of respondents said they are unable to replace aging trucks in their fleet. Meanwhile, 30% of respondents said they’re unable to fill customer service truck orders. This year’s results are almost identical to 2022’s data, except responses to fewer trucks operating in fleet, which has increased from 21% to 30%, suggesting that more fleets are operating with fewer vehicles due to their inability to replace aging trucks.
supply chain impacts
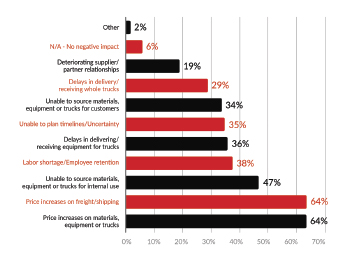
HOW HAVE SUPPLY CHAIN CHALLENGES IMPACTED YOUR BUSINESS? CHECK ALL THAT APPLY
When asked to check all that apply, most survey respondents (64%) indicated that they have been affected by price increases on materials, equipment, or trucks, and an equal 64% have been impacted by price increases on freight and shipping—similar to the results in 2022. Aside from the increase from 43% to 47% in challenges with sourcing materials, and labor shortages/employee retention, which increased from 31% to 38%, all supply chain challenges have trended down over the last year, suggesting that these challenges may be improving with time.
future business conditions
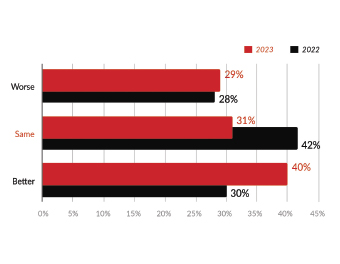
WHAT DO YOU THINK THE BUSINESS CONDITIONS WILL BE LIKE IN THE NEXT 12 MONTHS?
Respondents answered more optimistically as 40% predict better conditions. 31% think business conditions will remain the same while 29% predict worse conditions to come.
FOR MORE INFORMATION
The data from this piece was provided by VMAC. Download the complete survey at www.vmacair.com/survey.