
It’s been right at one year since COVID-19 dramatically changed lives here in the United States. The pandemic affected every industry in one way or another—but just how much was the work truck industry affected, specifically on the OEM chassis sales side? The folks at the National Truck Equipment Association (NTEA) have compiled the data from 2020. We’re here to break down some of it and share with you NTEA’s predications for 2021.
US/Mexico annual sales of Classes 2-8 commercial truck chassis
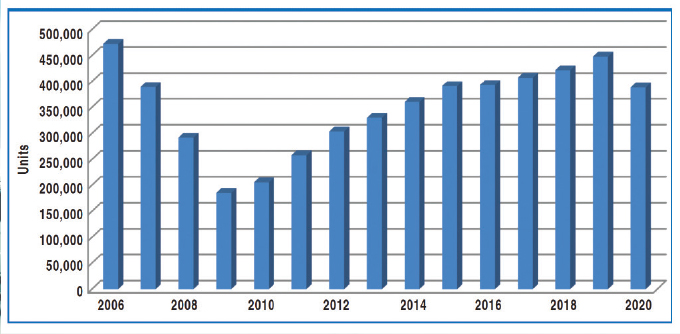
When it comes to the work truck industry as a whole in Class 2 through Class 8 commercial truck chassis, Figure 1 shows the impact the pandemic had on the market. NTEA’s compiled data discovered that Class 2 to Class 8 straight truck sales fell from roughly 440,000 units in 2019 to about 380,000 units in 2020, which is a 13.3% decline in sales.
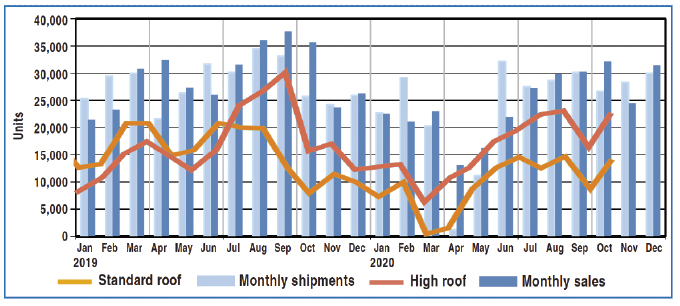
USMCA chassis sales cutaway, low cab-over-engine, and strip
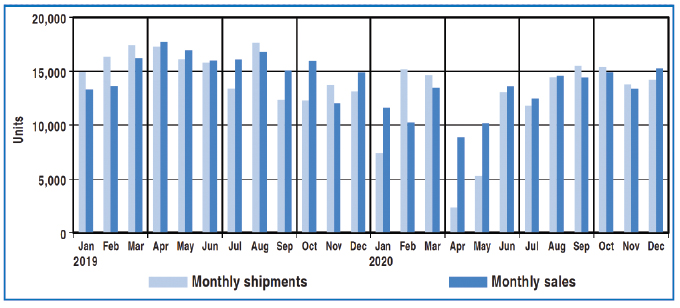
Figure 2 reflects data from January 2019 to December 2020. Although sales were at a steep low in April and May 2020, by the fourth quarter sales were up higher than the fourth quarter of 2019. The majority of growth was found in the strip chassis segment (17% increase). Cutaway sales fell about 2%, and low cab-over-engine sales dropped by 11%.
USMCA monthly factory shipments and sales and USMCA monthly commercial van sales
Commercial van sales in North America were virtually nonexistent in April 2020, and inventory plummeted with factory closures. However, Figure 3 reflects that in the third and fourth quarters of 2020, monthly sales increased near averages of 2019. A current forecast predicts sales will continue, boosting the commercial van market to about a 15% increase in sales for 2021.
US/Mexico commercial van sales (Class 1-3)
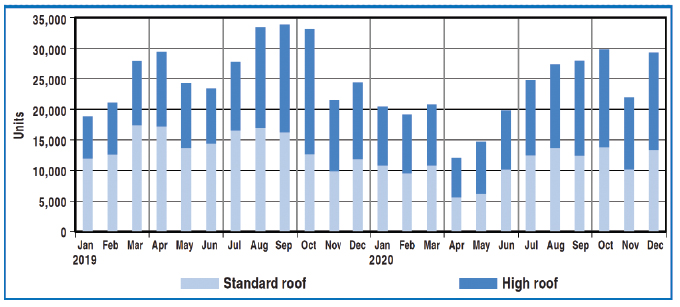
Figure 4 reflects commercial van sales from January 2019 to December 2020. The data shows a steady growth in sales after April 2020 that nearly reached 30,000 sales for the month of October. As with nonconventional truck sales, by the fourth quarter of 2020 van sales were up more than the fourth quarter of 2019. High-roof sales continue to outpace standard-roof heights.
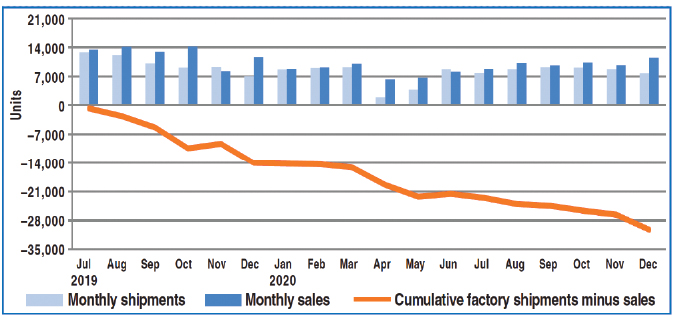
USMCA monthly factory shipments, sales, and cumulative inventory – standard roof commercial vans (Class 1-3)
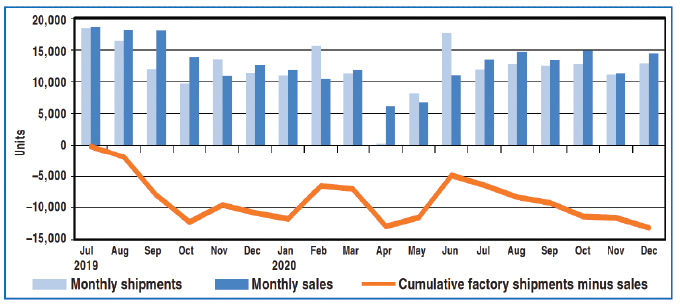
Figure 5 reflects a segment analysis for the commercial van market. Standard-roof height sales outpaced shipments for the last six months of 2020. As of December, the 18-month cumulative difference between shipments and sales was about 13,500 units in the negative. This is about equal to one month of sales and signals stretched lead times.
USMCA monthly factory shipments, sales, and cumulative inventory – high roof commercial vans (Class 2-3)
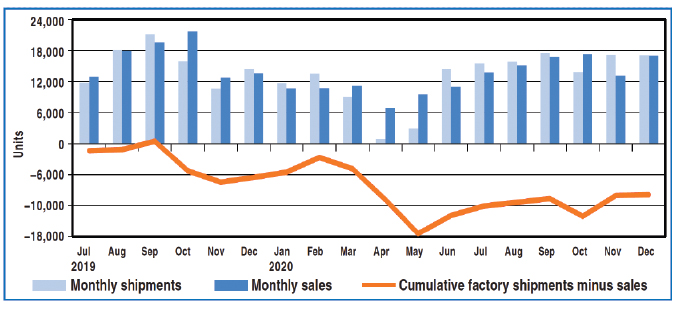
Figure 6 reflects sales vs shipments for high-roof vans. In contrast to standard-roof vans, shipments slightly outpaced sales in the fourth quarter of 2020. The 18-month difference between shipments and sales improved to about 11,000 units in the negative. This is a bit less than current monthly sales. Lead times are slightly longer than normal.
USMCA monthly factory shipments, sales, and cumulative inventory – all cab types (Class 2 straight trucks)
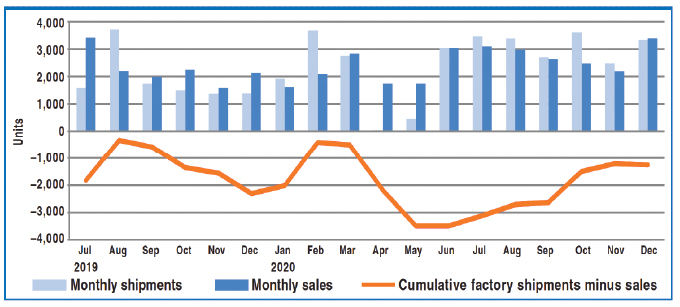
Figure 7 reflects monthly sales vs shipments for commercial trucks in Class 2. Shipments outpaced sales in the third and fourth quarters of 2020. The 18-month difference between shipments and sales improved to about 1,250 units in the negative. This is less than half of current monthly sales. It signals near normal lead times.
USMCA monthly factory shipments, sales, and cumulative inventory – all cab types (Class 3-5 straight trucks)
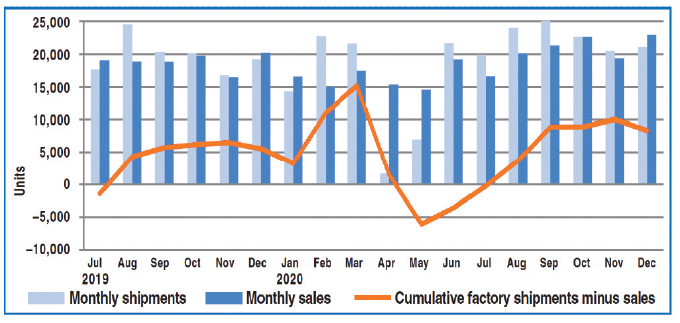
Figure 8 reflects shipments vs sales for Class 3 to Class 5 commercial trucks. In the fourth quarter of 2020, sales and shipments were almost balanced. The 18-month cumulative difference between shipments and sales was steady near 10,000 units. Lead times were normal. As of December 2020, 18-month differences were positive in the three weight classes.
USMCA monthly factory shipments, sales, and cumulative inventory – all cab types (Class 6-7 straight trucks)
For shipment vs sales data for Class 6 and Class 7 commercial trucks, view Figure 9. Chassis sales outpaced shipments in every month of the second half of 2020, which indicates that OEM sales expectations were not positive. But the 2021 sales forecast is optimistic. NTEA predicts OEMs to ramp up production in the first half of 2021.
USMCA monthly factory shipments, sales, and cumulative inventory – all cab types (Class 8 straight trucks)
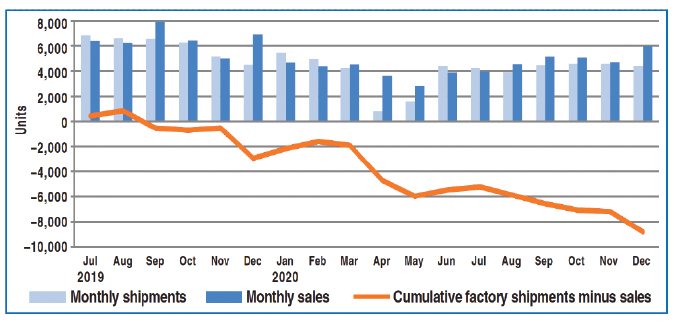
Figure 10 reflects Class 8 commercial truck chassis sales vs shipments. Sales outpaced shipments in the last five months of 2020. As of December, the 18-month difference fell to about 8,500 units in the negative, which is more than one month of current sales. However, OEMs could start increasing production to support sales in the first half of 2021.
FOR MORE INFORMATION
The information in this article was provided by NTEA. Find out more predictions and see in-depth data from 2020, visit www.ntea.com.