Vehicle-mounted air compressor manufacturer, VMAC, is back once again with its third State of the Mobile Compressed Air Industry survey. For the 2022 report, VMAC surveyed 340 individuals between November 2021 and February 2022. These individuals came from a variety of industries such as construction, oil and gas, forestry, municipal, mining, transportation, agriculture, and utilities infrastructure. One thing each participant had in common—although each represented various industries and held different job titles—is that they use mobile air compressors.
Much like last year’s survey, VMAC included questions about the supply chain and effects of COVID-19 in this year’s report. The company also added new questions for 2022 about the truck chassis shortage, electric vehicles, and additional questions about the supply chain that has continued to affect the industry over the last year. Read on to find out how the industry outlook has changed for key topics from 2021 to this year.
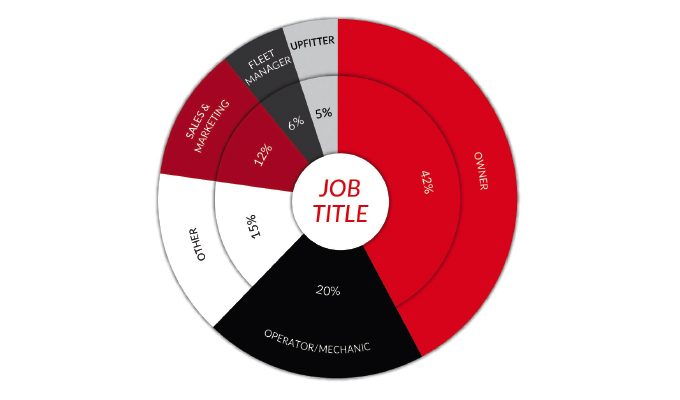
job title
SELECT THE JOB TITLE/FUNCTION THAT BEST DESCRIBES YOU
Much like last year, the largest respondent group consisted of owners (42%). Operator/mechanics consisted of 20% of survey respondents. The remaining 38% of respondents comprised of sales and marketing, fleet managers, upfitters, and others.
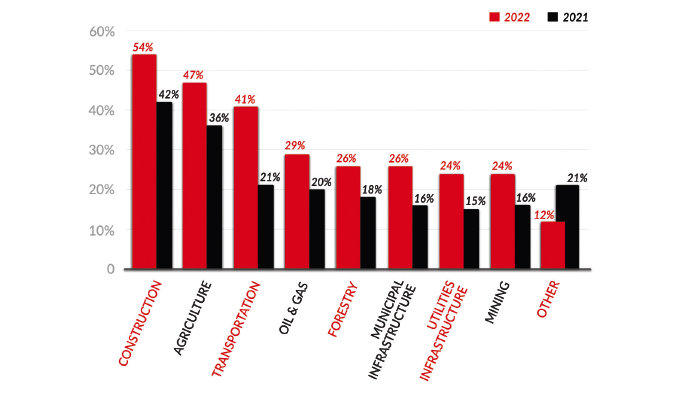
industries served
WHAT INDUSTRY DO YOU SERVE? CHECK ALL THAT APPLY.
Construction representation went up to 54% compared to last year’s 42%. Agriculture remained the second most represented at 47%. Each other industry also increased in industry representation. VMAC suggests a possible reason for increased representation could be that businesses are diversifying their offerings.
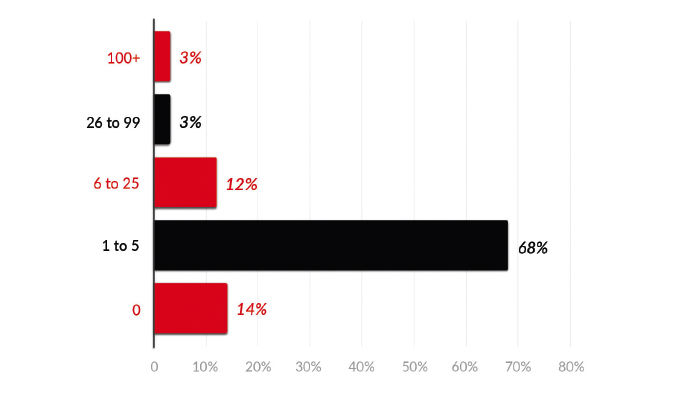
size of fleet
HOW MANY SERVICE TRUCKS ARE IN YOUR COMPANY’S FLEET?
The vast majority of this year’s survey respondents (68%) run small fleets of five trucks or fewer. Once again, the second largest group of respondents had fleets of six to 25 trucks at 12%.
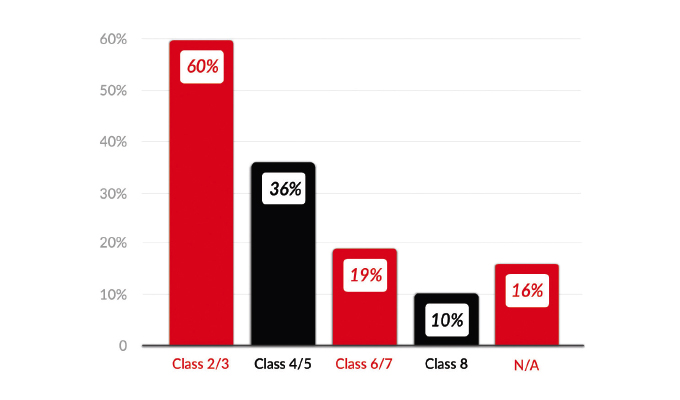
vehicle class
WHICH CLASSES OF SERVICE TRUCKS DO YOU HAVE IN YOUR FLEET? CHECK ALL THAT APPLY.
The majority of respondents (60%) have fleets of Class 2 and 3 vehicles. Class 4 and 5 made up the next highest majority with 36%, Class 6 and 7 fleets consisted of 19% of respondents, and Class 8 fleets consists of 10% of survey respondents.
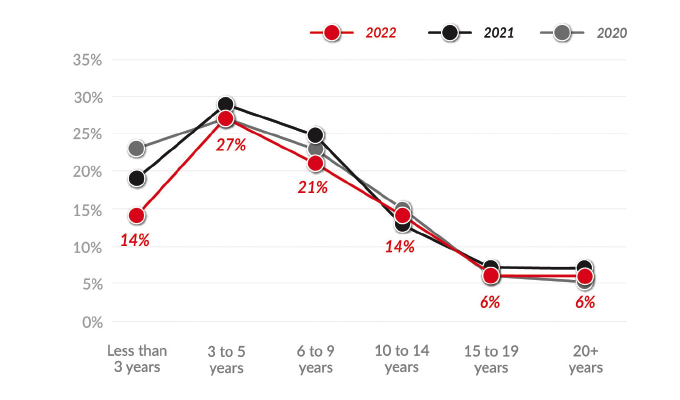
age of fleet
WHAT IS THE AVERAGE AGE OF THE SERVICE VEHICLES IN YOUR FLEET?
According to the survey, 27% of fleets own vehicles from 3 to 5 years old, while 21% of fleets own vehicles from 6 to 9 years old. Only 12% of fleets own vehicles from 15 to 20-plus years old.
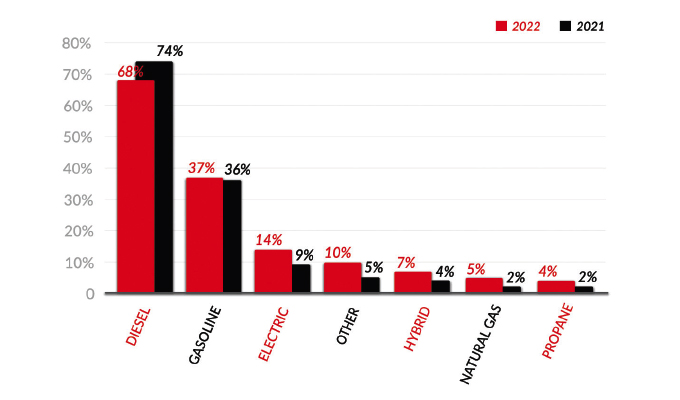
fuel type of future vehicles
WHAT KIND OF SERVICE VEHICLES ARE YOU INTERESTED IN PURCHASING? CHECK ALL THAT APPLY.
Diesel was the clear choice for planned vehicle purchases yet again, with only a slight drop to 68% from 2021’s 74%. Gasoline was next in line for fuel type plans at 37%. According to survey respondents, alternative-fuel vehicles remained a less desirable choice of fleets; however, electric vehicles received a bump of interest from last year’s 9%.
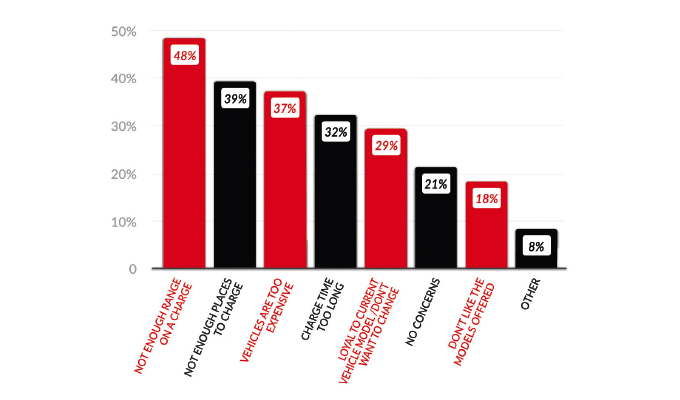
concerns of going electric
DO YOU HAVE ANY CONCERNS ABOUT HAVING AN EV SERVICE VEHICLE? CHECK ALL THAT APPLY.
A new question this year pertained to fleet owner concerns about switching to electric vehicles (EVs). Almost half (48%) indicated range concerns. Charging infrastructure and charging station quantity was a concern of 39% of respondents.
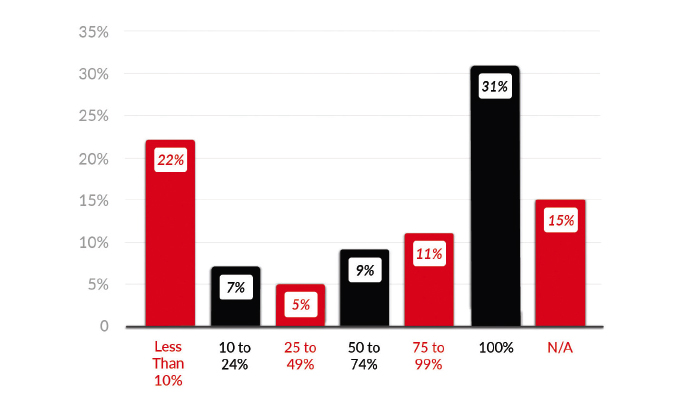
air compressors in the fleet
WHAT PERCENT OF YOUR SERVICE VEHICLES ARE EQUIPPED WITH AIR COMPRESSORS?
From 2020’s survey to now, respondents indicate a divide in their fleets concerning vehicles equipped with air compressors and vehicles that don’t have them. The report indicates that fleets with fewer vehicles (one to five) in their fleet are more likely to equip all vehicles with air compressors. Fleets with 100-plus vehicles are less likely to equip all vehicles with air compressors.
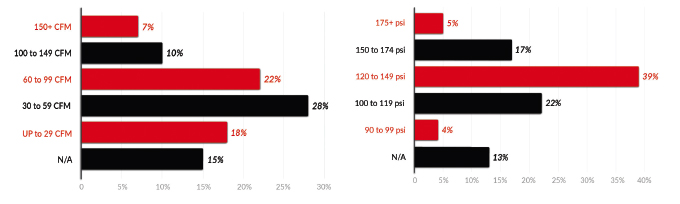
cfm/psi requirements
WHAT CFM RANGE BEST FITS YOUR REQUIREMENTS FOR YOUR SERVICE VEHICLES?
Almost half of VMAC’s survey respondents require up to 59 CFM on service vehicles (46%). Those who require 60 to 149 CFM make up 32% of respondents.
WHAT PSI RANGE BEST FITS YOUR REQUIREMENTS FOR YOUR SERVICE VEHICLES?
All but 17% of respondents indicated a need for 100 psi or more. This number is also consistent with last year’s number.

rotary vs reciprocating
DO YOU PREFER ROTARY SCREW OR RECIPROCATING AIR COMPRESSORS FOR SERVICE VEHICLES?
A vast majority of respondents prefer a rotary screw (80%), while only 20% prefer a reciprocating air compressor—the same exact numbers as 2021’s survey results.
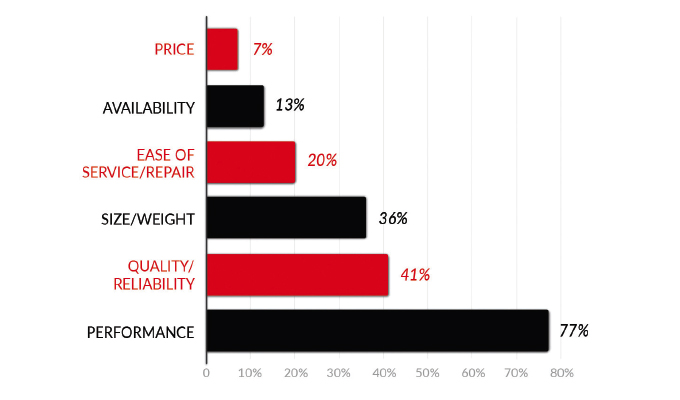
why rotary screw
WHY DO YOU PREFER ROTARY SCREW AIR COMPRESSORS? CHECK ALL THAT APPLY.
The majority of respondents (77%) noted they prefer a rotary screw compressor because of performance, 41% indicated quality and reliability, and 36% said size and weight.
why reciprocating
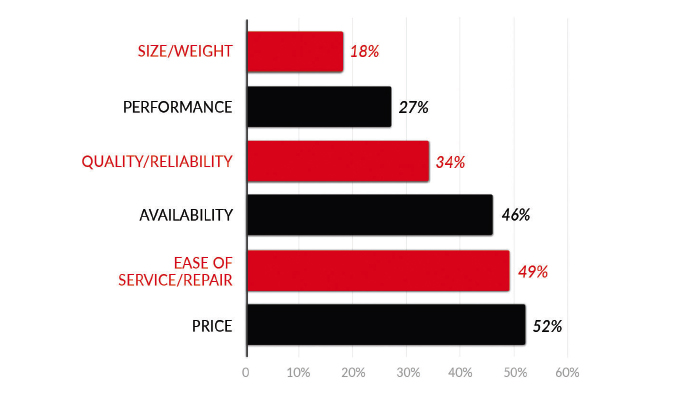
WHY DO YOU PREFER RECIPROCATING AIR COMPRESSORS? CHECK ALL THAT APPLY.
The majority (52%) of those who prefer reciprocating air compressors prefer them for their price, ease of service (49%), and availability (46%). Other qualities include quality and reliability, performance, and size and weight.
air compressor systems
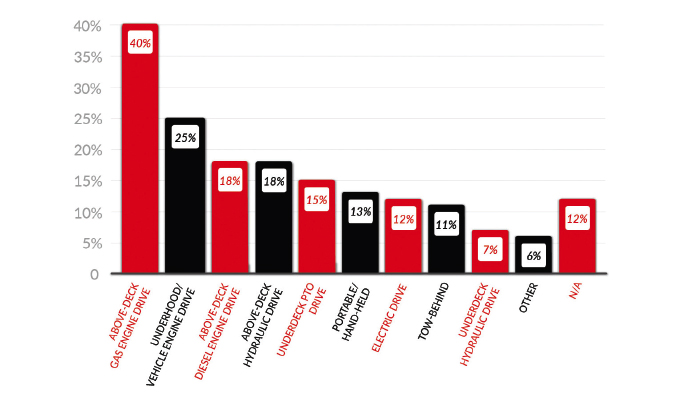
WHAT TYPE OF SYSTEM DO YOU USE ON SERVICE VEHICLES? CHECK ALL THAT APPLY.
Nearly half of all respondents (40%) use above-deck gas engine drive air compressors. Next up is an UNDERHOOD™ or vehicle-engine driven air compressor at 25%.
compressor system preferences
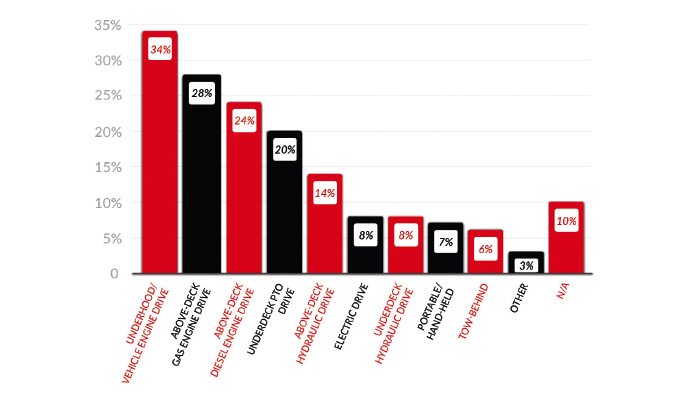
WHAT TYPE OF SYSTEM DO YOU USE ON SERVICE VEHICLES? CHECK ALL THAT APPLY.
The UNDERHOOD air compressor is the most preferred air compressor at 34%. The next most preferred type is the above-deck gas-powered air compressor at 28%. The above-deck diesel-powered air compressor rounds up the top three system preferences at 24%.
covid’s impact
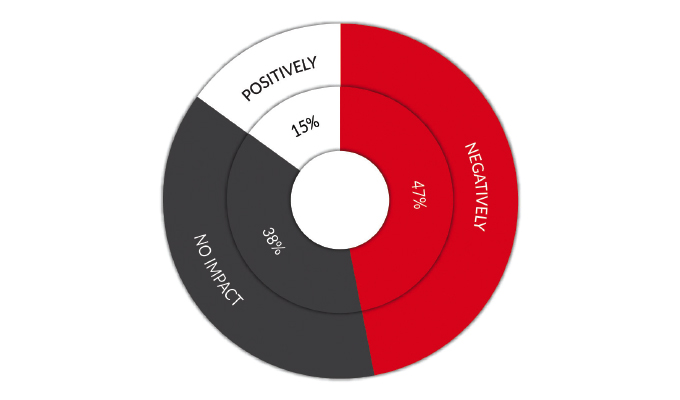
HOW HAS COVID-19 IMPACTED YOUR BUSINESS?
It’s been two years since the pandemic began, but businesses are still impacted. According to respondents, 47% have experienced a negative impact from the pandemic. On the flip side, 15% say they have seen a positive impact from the pandemic, while 38% have seen no impact on business operations.
specific impacts
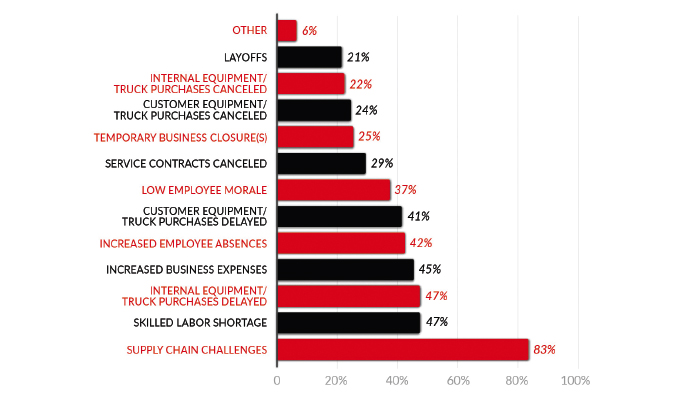
HOW HAS COVID-19 IMPACTED YOUR BUSINESS? CHECK ALL THAT APPLY.
The most significant challenge noted this year was supply chain challenges (83%). Tied for second most significant challenge were labor shortages and equipment and truck purchases delayed (47%). Other challenges included increased expenses (45%) and increased employee absences (42%).

chassis shortage impact
HOW HAS THE SHORTAGE OF TRUCK CHASSIS IMPACTED YOUR BUSINESS?
According to the survey, fleets are split. About half (48%) said the chassis shortages have had no impact on their business, while the other half (46%) indicated a negative impact. A small percentage (6%) indicated a positive impact from the truck chassis shortage.
impacts of chassis shortage
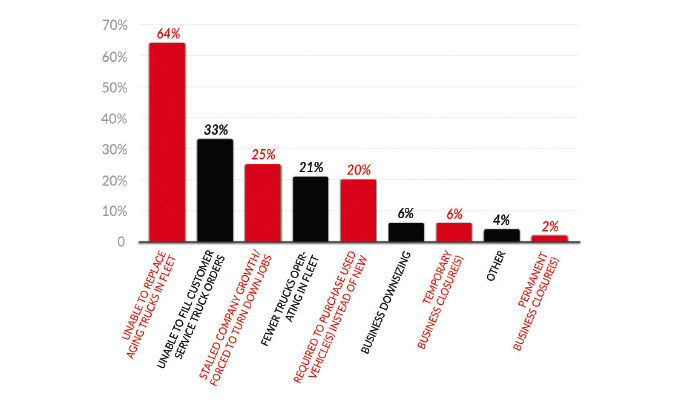
WHAT WAYS HAS THE SHORTAGE OF CHASSIS IMPACTED YOUR BUSINESS? CHECK ALL THAT APPLY.
More than half of respondents (64%) indicated that they have been unable to replace aging trucks in their fleet. A third of respondents (33%) noted they were unable to fill customer service truck orders, and 25% indicated stalled company growth as an impact of the truck chassis shortage.
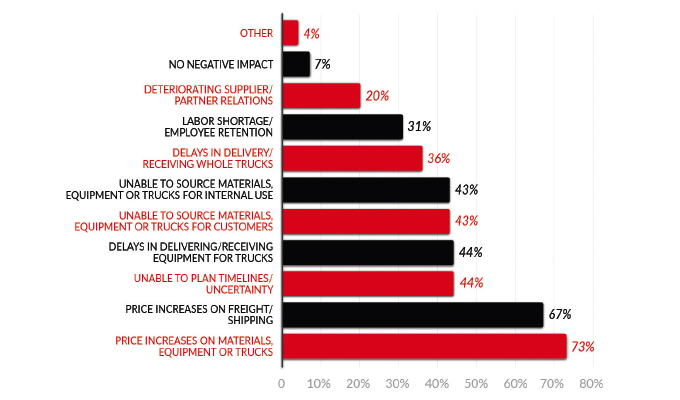
supply chain impacts
HOW HAVE SUPPLY CHAIN CHALLENGES IMPACTED YOUR BUSINESS? CHECK ALL THAT APPLY.
Almost three-fourths of respondents (73%) noted price increases on materials, equipment, and/or trucks. The second highest impact at 67% were price increases on freight and shipping. Tied for the third largest impact at 44% were unable to plan due to uncertainty and delays in receiving or delivering equipment for trucks.
FOR MORE INFORMATION
The data from this piece was provided by VMAC. Download the complete survey at www.vmacair.com/survey.