Comprehensive fleet data and robust reporting can transform how fleets operate, providing the insights needed to optimize performance and secure resources. Generating reports from such data provides the evidence needed to justify key decisions, such as replacing assets that don’t meet standard replacement criteria but are costing more to operate.
Fleet management technologies simplify data collection and reporting, enabling fleets to generate clear, actionable insights they can present in an easy-to-understand format for stakeholders reviewing the requests. Fleet data can also help fleets identify areas of unnecessary spending to optimize operations and reduce costs — which can make advocating for needed resources a bit less stressful.
THE ROLE OF FLEET DATA IN DECISION-MAKING
Whether it’s pinpointing fuel inefficiencies, flagging assets with recurring component issues, or streamlining workflows, data-driven insights make advocating for needed resources a bit less stressful. In business, not everyone will understand fleet operations, but everyone understands numbers — especially profit and loss. This allows fleet managers to start speaking the same language as leadership, and positions them to better advocate for the tools, assets, or upgrades required to keep the fleet running smoothly.
Fleet data helps managers identify areas of unnecessary spending to optimize operations and reduce costs. Generating reports from such data provides the evidence needed to justify key decisions, such as replacing assets. For instance, an asset that’s technically still functional but requires frequent repairs might not meet a company’s mileage- or age-based replacement policy but without the right data, a request to replace it could be met with skepticism.
However, a detailed report showing that the asset costs 50% percent more per mile than similar assets, combined with metrics on unplanned downtime and lost productivity, can turn a no into a yes. Demonstrating the money that stands to be lost by keeping an underperforming asset in the fleet makes a compelling case for change.
OVERCOMING DATA ANALYTICS OVERLOAD
Sometimes, data analytics can be a roadblock when starting out with both fleet management and fleet management technologies. This can lead fleet managers to fall back on their industry knowledge and gut instinct which, while valuable, can steer you toward missing out on being more proactive when it comes to workflows and tackling issues. Especially when talking to leadership, a gut instinct isn’t quite as valuable as hard data.
For example, fleet managers often report to multiple departments, like finance and operations, and need buy-in from these stakeholders to secure funds for new assets, technologies, or telematics upgrades. Having good data and reporting can be the difference between approval and rejection when proposing changes to improve fleet performance.
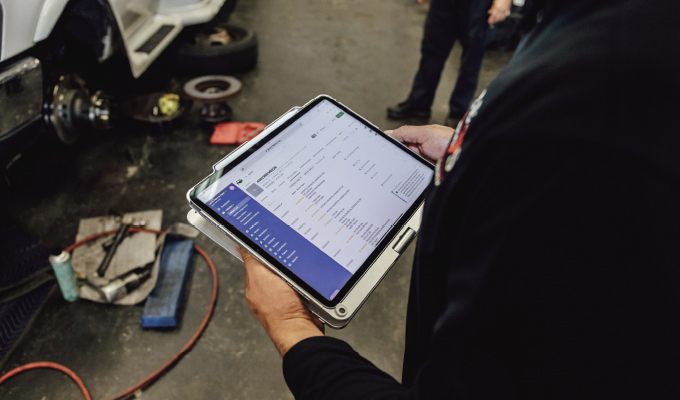
The good news? You don’t even need a degree in data science to get there. Fleet management technologies simplify data collection and reporting, enabling managers to generate clear, actionable insights they can present in an easy-to-understand format for stakeholders reviewing the requests. Fleet optimization platforms and other maintenance and management solutions collect data in the background with minimal manual action needed.
When integrated with other business and fleet solutions, they automatically consolidate this data, so you don’t have to check multiple sources. These solutions also run reports for you, and you can set the system up so that it emails the desired metrics to the right people at intervals of your choosing, keeping everyone in the loop.
KEY METRICS TO TRACK AND REPORT
Regardless of how you’re tracking fleet data, you should focus on logging and analyzing key metrics that reveal performance trends and highlight areas for improvement, including:
- Odometer readings: Log odometer readings to keep track of mileage and plan for preventive maintenance (PM) so you aren’t surprised when an asset is in the shop. Good PM means fewer unplanned repairs, which leads to less downtime and lower operational costs.
- Fuel use: Log fuel use to calculate miles per gallon so you can see which assets — or drivers — are using more fuel than others. Identifying inefficiencies here can lead to targeted interventions, such as driver training or asset replacement.
- Repair and maintenance data: Log repair and maintenance data to see which assets have recurring problems and which are falling behind on their scheduled maintenance. This helps prioritize repairs and flag an asset that may be nearing the end of its useful life.
- Cost per mile: Combine the above metrics to calculate an asset’s cost per mile so you can make informed decisions about when an asset is costing you more than it’s worth. This metric is particularly persuasive when justifying replacements or upgrades to leadership.
Chart your fleet data in reports to measure trends over time. This allows you to show how much an asset or process is costing the fleet and why change is needed. For example, a report showing an asset’s rising repair costs, fuel inefficiency, and downtime hours can make a clear case for replacement, even if the asset hasn’t hit the predetermined mileage threshold. Visualizing these trends in graphs or tables makes the data accessible and compelling for non-fleet stakeholders.
DRIVING EFFICIENCY ACROSS THE FLEET
Efficiency is the name of the game, whether you’re running a construction fleet, a municipal fleet, or any other type of operation. You should always be shooting for three primary goals: get things done cheaper, faster, and better — all without sacrificing quality control. Using your data lets you find places where you can cut back on unnecessary spending while making everything else streamlined.
For example, optimizing maintenance schedules based on data can help reduce downtime, allowing your team to complete projects or routes on time and within budget. These improvements not only enhance performance but also demonstrate your value — and the value of your input — as a manager to leadership.
PRESENTING DATA FOR MAXIMUM IMPACT
The key to leveraging fleet data is presenting it in a reliable format that everyone can see and understand. It could be a regular PowerPoint you update for a quarterly meeting, an exported report from your fleet management solution that you send out to everyone who needs to be in the know, or even just a bolded column on your spreadsheet. Whatever you use, make it clear where the numbers are leading, and make sure anyone who wants to see it can. Not only does that make it open and apparent what’s going on in the fleet, but it also gives you the ultimate form of accountability as a fleet manager. Everyone can see the ways you’re improving and the ways you may be falling short. Clear, transparent reporting also builds trust with stakeholders and fosters collaboration to ensure that fleet decisions align with broader business goals.
USING DATA AS AN ALLY
Fleet data and reporting are more than just tools — they’re potentially your strongest allies in managing a complex operation. Putting all your data into a reliable format that everyone can see and understand empowers you to make informed decisions, advocate for resources, and drive efficiency. Whether you’re justifying an asset replacement, proposing new technology, or simply keeping your team on track, data provides the clarity and accountability needed to succeed. With the right fleet management technologies, collecting and presenting this data is easier than ever, allowing you to focus on what matters most — running a cheaper, faster, and better fleet.
about the author
Rachael Plant is a senior content marketing specialist for Fleetio, a fleet optimization To learn more, visit www.fleetio.com.